Overview
Teaching: 15 min
Exercises: 15 minQuestions
How can observations be symbolized to show systematic error and uncertainty by collector, or data quality score?
Objectives
Bin points based on uncertainty rank.
How many points are over an acceptable threshold of uncertainty? (by taxa, genus, collector, year…) Cluster around… distribution of genus separately and evaluate for outliers - data cleaning
- Goal: find categories of points to manually evaluate
- Tool: Field Calculator, Basic Statistics for Numeric Field
- Output: an html file with statistics for the selection
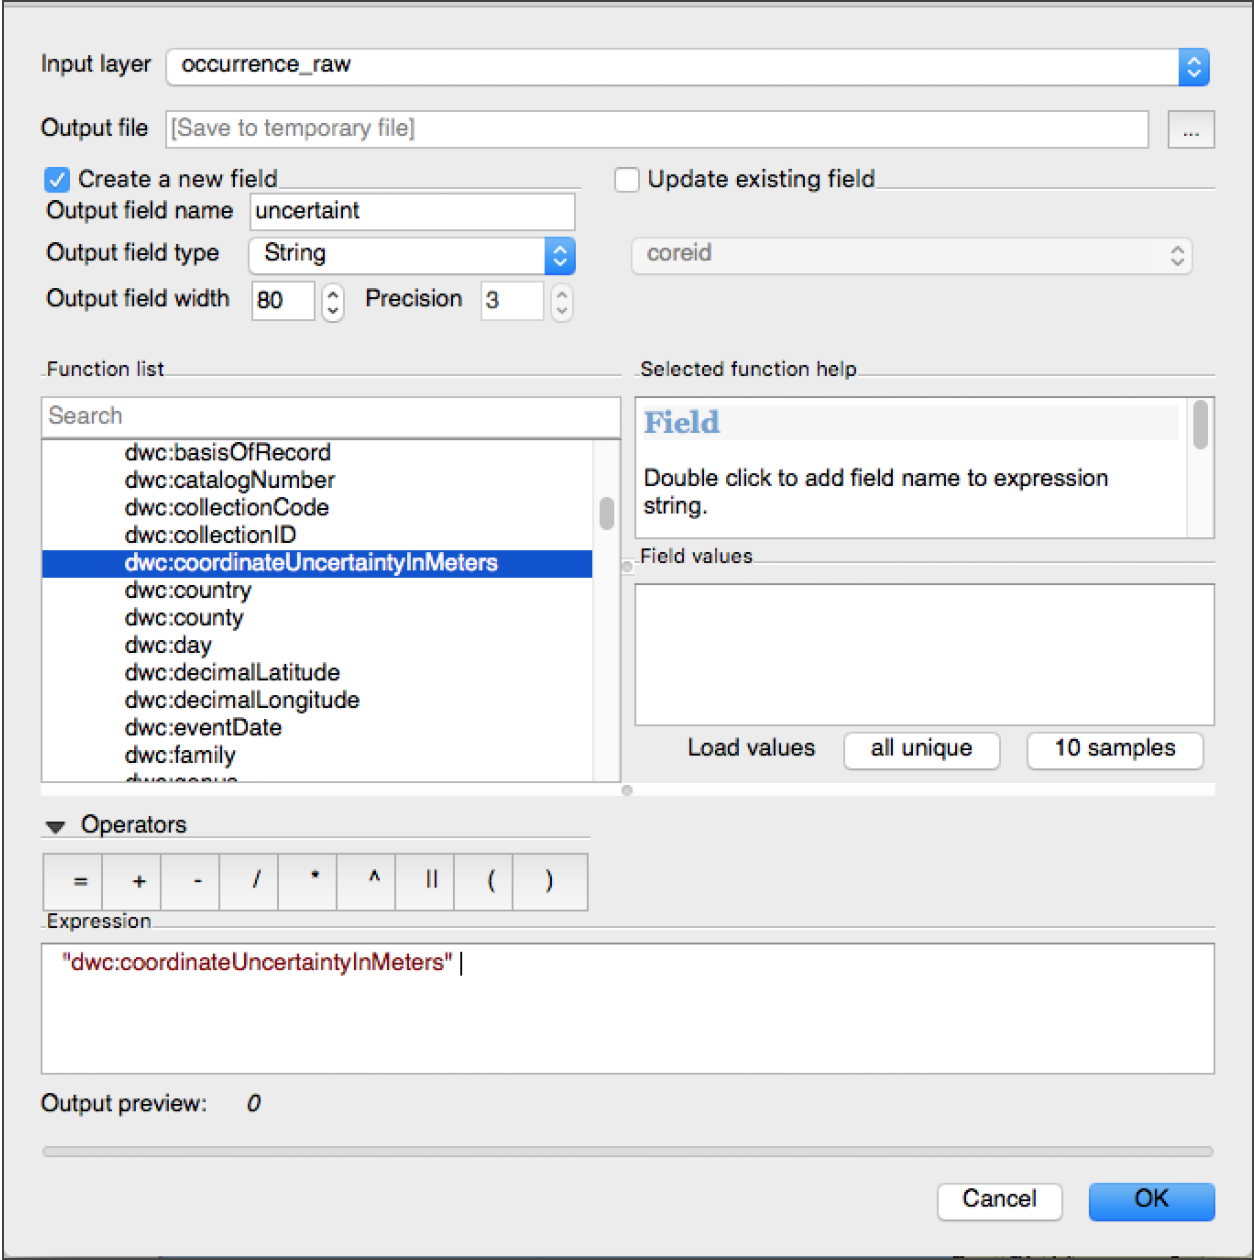
Open Field Calculator. In order to perform any numeric analysis on our occurrences_raw.csv points, they need to be interpreted as numbers rather than as strings. We can convert the field without overwriting it by creating a new column in our attribute table. Know that you can also apply functions to existing columns using the Field Calculator.
Open Basic Statistics for Numeric Field. Choose a field of interest, such as coordinate uncertainty in meters on which to perform the analysis.
Heatmap
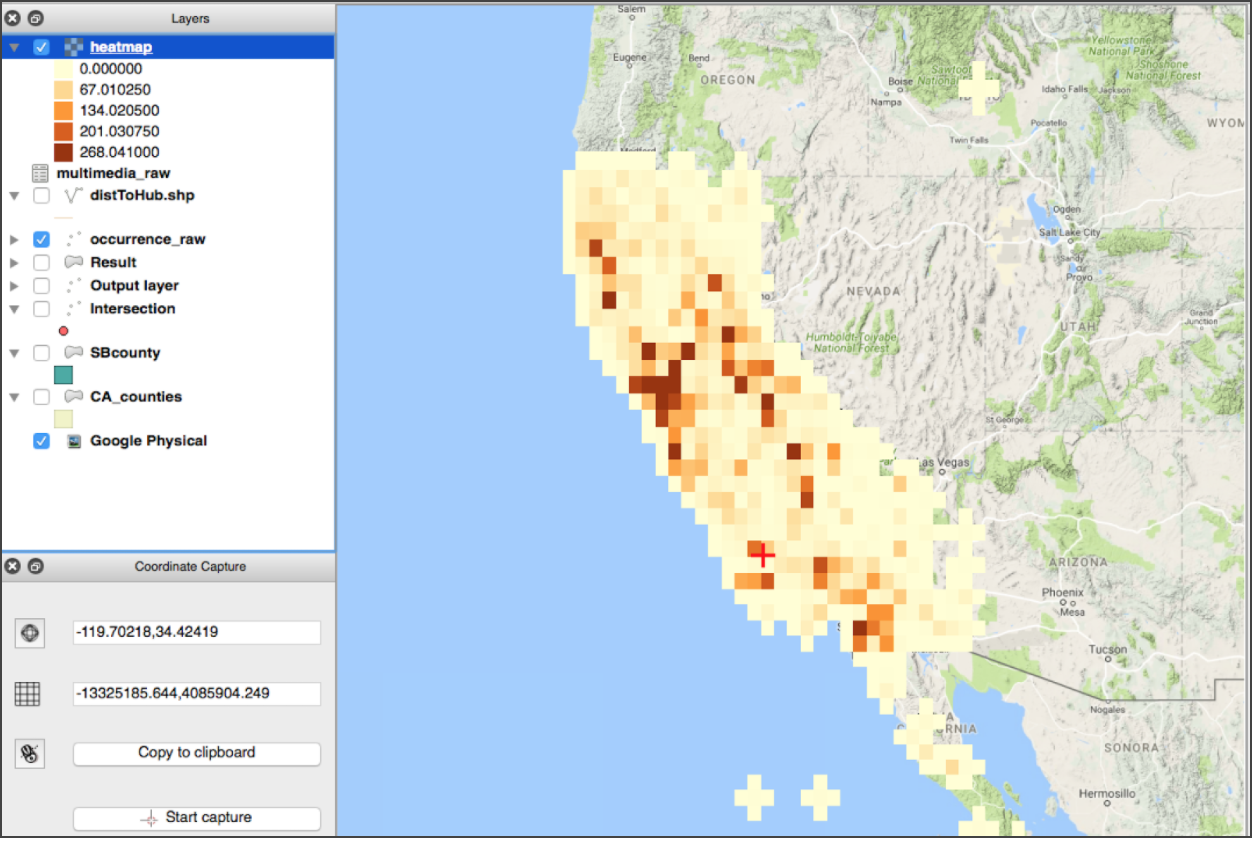
Are there any clusters or hotspots of observations?
- Goal: find categories of points to manually evaluate
- Tool: Field Calculator, Summary Statistics - attribute table
- Output: an html file with statistics for the selection
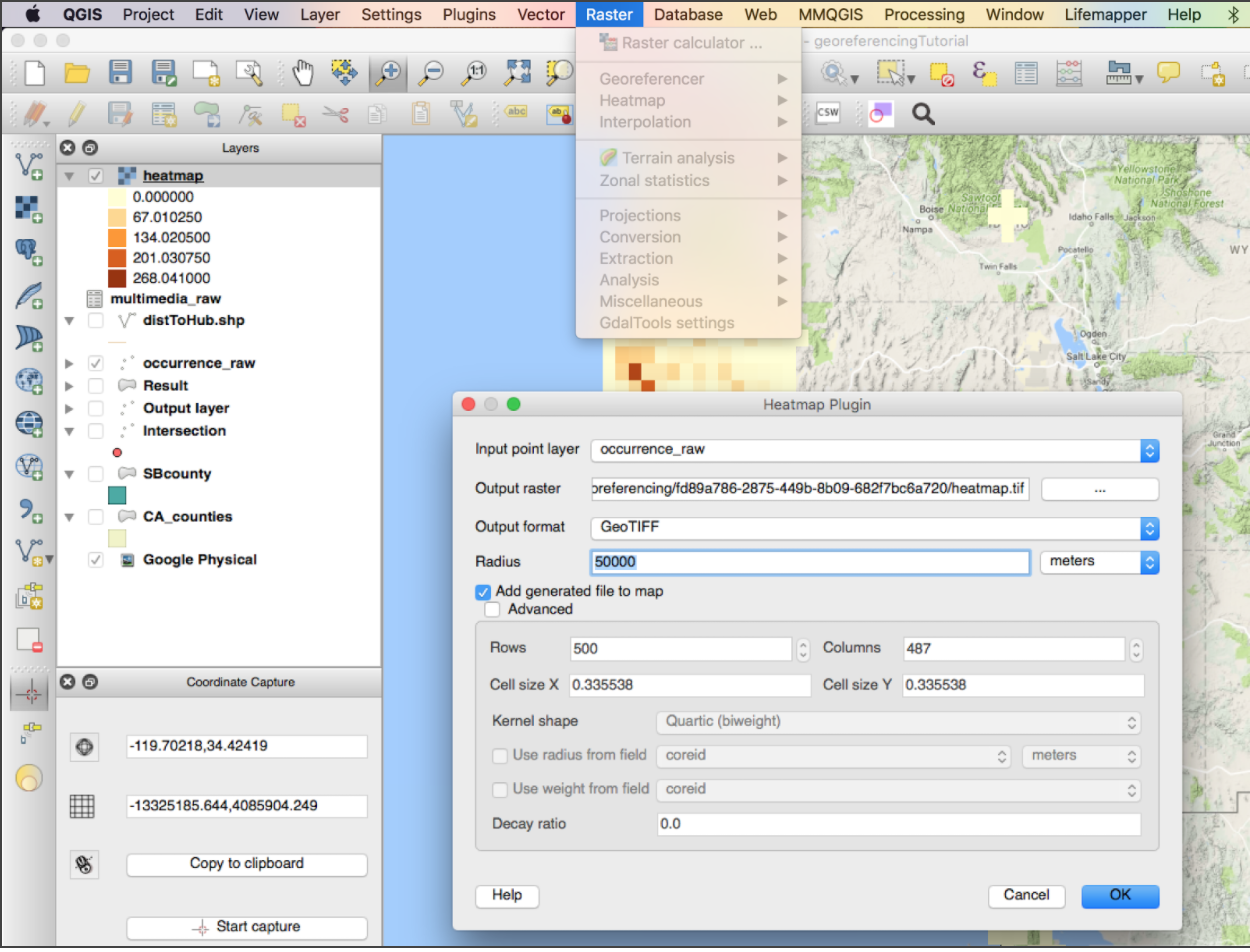
Heatmaps are used to identify clusters or hotspots. In the Heatmap Plugin dialog, enter 50,000 meters as the Radius. Radius is the area around each point that will be used to calculate the ‘heat’ a pixel received.
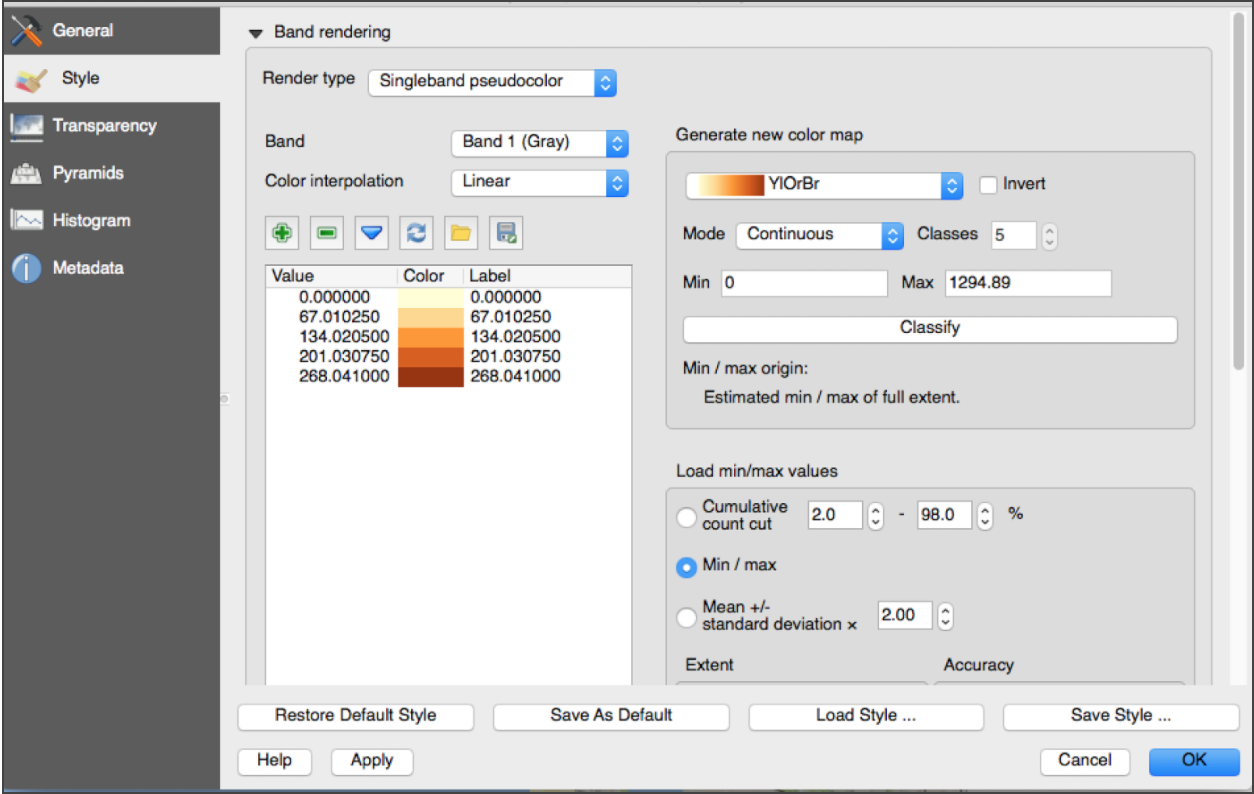
Change the symbology to a pseudocolor ramp and classify to make the heatmap more legible.
You can experiment with different search radii or pixel sizes by enabling advanced features.
Key Points