

Spatio-Temporal Data Hackathon
Test Post
Ben Best
2015-10-27
Intro
This is an R Markdown document. Markdown is a simple formatting syntax for authoring HTML, PDF, and MS Word documents. For more details on using R Markdown see http://rmarkdown.rstudio.com.
When you click the Knit button a document will be generated that includes both content as well as the output of any embedded R code chunks within the document. You can embed an R code chunk like this:
\[ S = \sum_{i=0}^{N} x_i * w_s \]
Methods
#knitr::opts_knit$get("header")
#knitr::set_header(tikz = "----\ntest: hey\n----\n")
rmarkdown::metadata
## $title
## [1] "Test Post"
##
## $author
## [1] "Ben Best"
##
## $date
## [1] "`r format(Sys.time(), '%Y-%m-%d')`"
##
## $output
## [1] "html_document"
##
## $category
## [1] "time-series-workshop"
##
## $tags
## [1] "module-1"summary(cars)## speed dist
## Min. : 4.0 Min. : 2.00
## 1st Qu.:12.0 1st Qu.: 26.00
## Median :15.0 Median : 36.00
## Mean :15.4 Mean : 42.98
## 3rd Qu.:19.0 3rd Qu.: 56.00
## Max. :25.0 Max. :120.00DT::datatable(cars)You can also embed plots, for example:
Plot
plot(cars)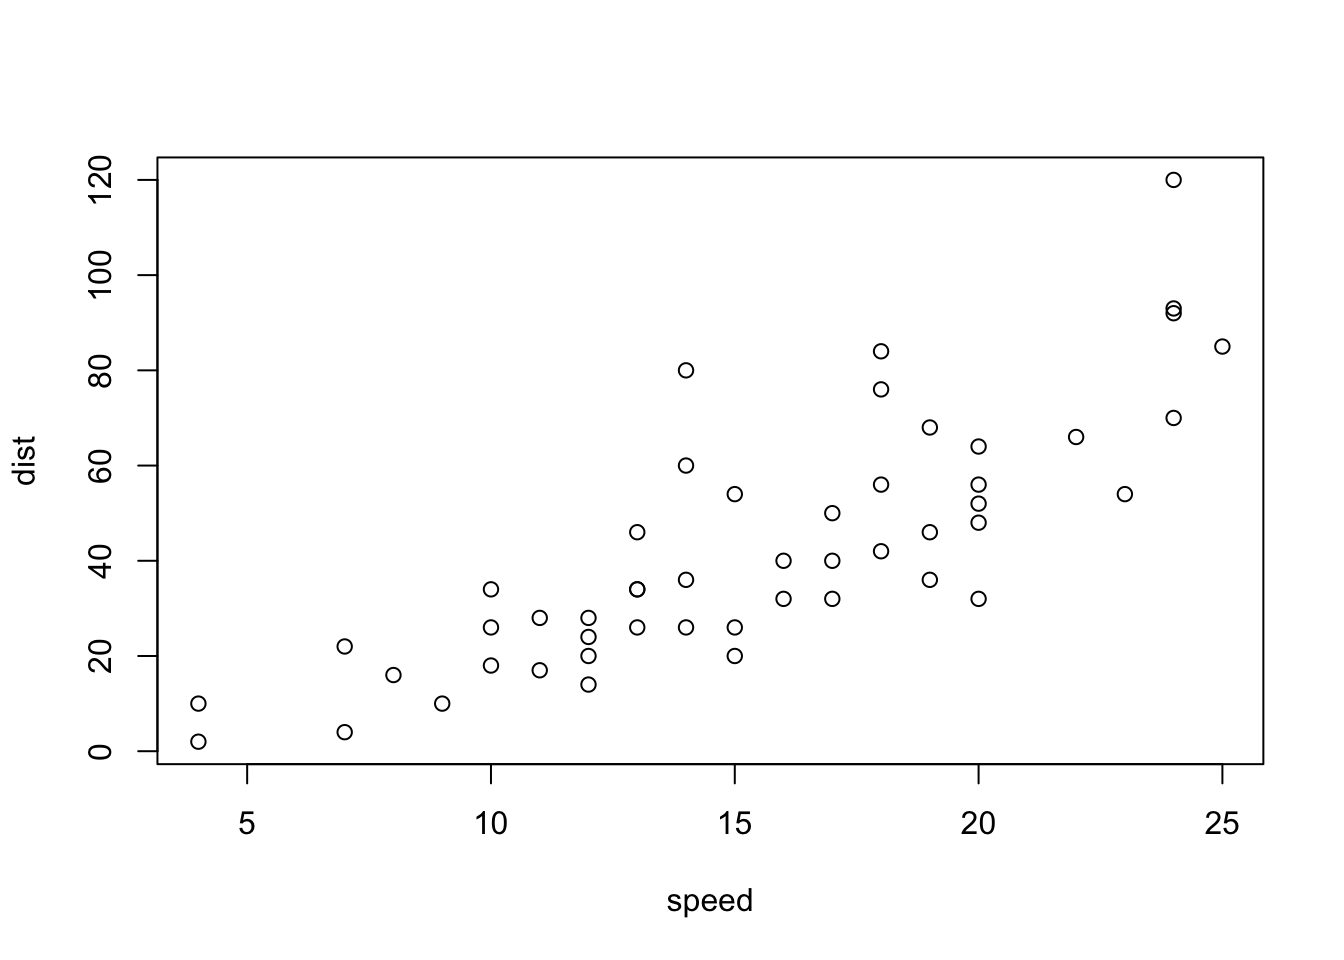
Note that the echo = FALSE parameter was added to the code chunk to prevent printing of the R code that generated the plot.